
Finisher Data Analysis: Badwater Ultramarathon, 1990-Present
Notes in Chronological Order
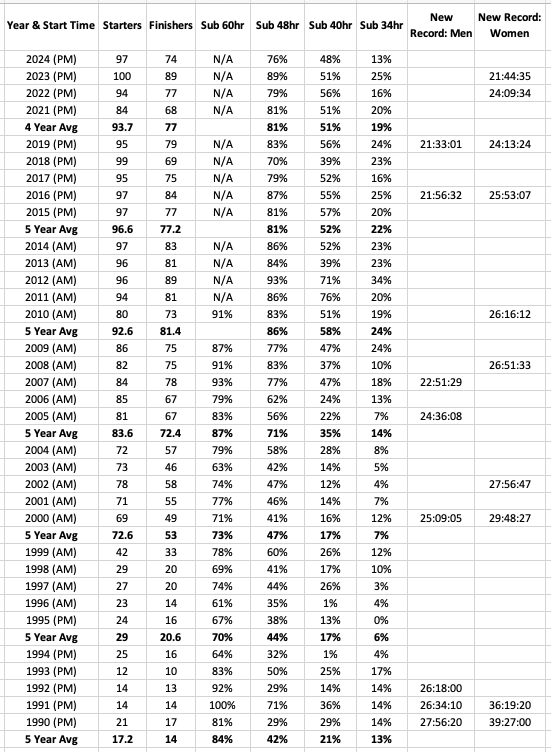
1987 through 1989: Data was not included because it is incomplete and because the route was 11 miles longer than the route used from 1990 through the present. “Badwater 146” – with the finish line illegally at the summit of Mt. Whitney – only took place in 1987, 1988, and 1989, so in the entire history of the race, that route was used just three times. In fact, only 11 individuals ever finished the race at mile 146, the summit of Mt. Whitney.
1990 through 1995: The race began in the evening (a “PM Start”), which became the norm again in 2015.
1999: The feature length documentary film “Running on the Sun” was filmed; coupled with a larger field than before there was perhaps a higher than average “drive to succeed” and thus a better finishing rate.
2000 to the present: With AdventureCORPS organizing the race, the race field became much larger and more international, and thus significantly faster and more competitive than in previous years.
2002 and 2003: Pam Reed, a female, won the race overall.
2003: This year, even by Badwater standards, was “extra hot.” Thus the finishing and buckling cut-off averages dipped, rather than rose, that year. Interestingly, the sub-40 hour and sub-34 hour averages rose, so apparently the very top competitors were not negatively affected by the heat.
2011: In light of the increasingly faster finishing times, the overall cut-off was dropped from 60 hours to 48 hours.
2014: While the Park Service conducted a “safety analysis” of sporting events within Death Valley National Park, the race was held on an alternate route based in Lone Pine. The course had more climbing than the traditional route and featured the same final 1/3 of the route from Darwin to Whitney Portal, but was not quite as hot.
2015: Due to new National Park Service requirements, the race moved back to an evening start instead of morning starts as in 2000-2014. As the statistics show – and as veterans with both AM and PM start experience attest – this has made the race tougher and slightly slower for most of the participants, compared to 2000-2014.
2023: Ashley Paulson, a female, won the race overall. (2002 and 2003 female and overall winner Pam Reed also competed this year, notching her 12th finish.)